Overview
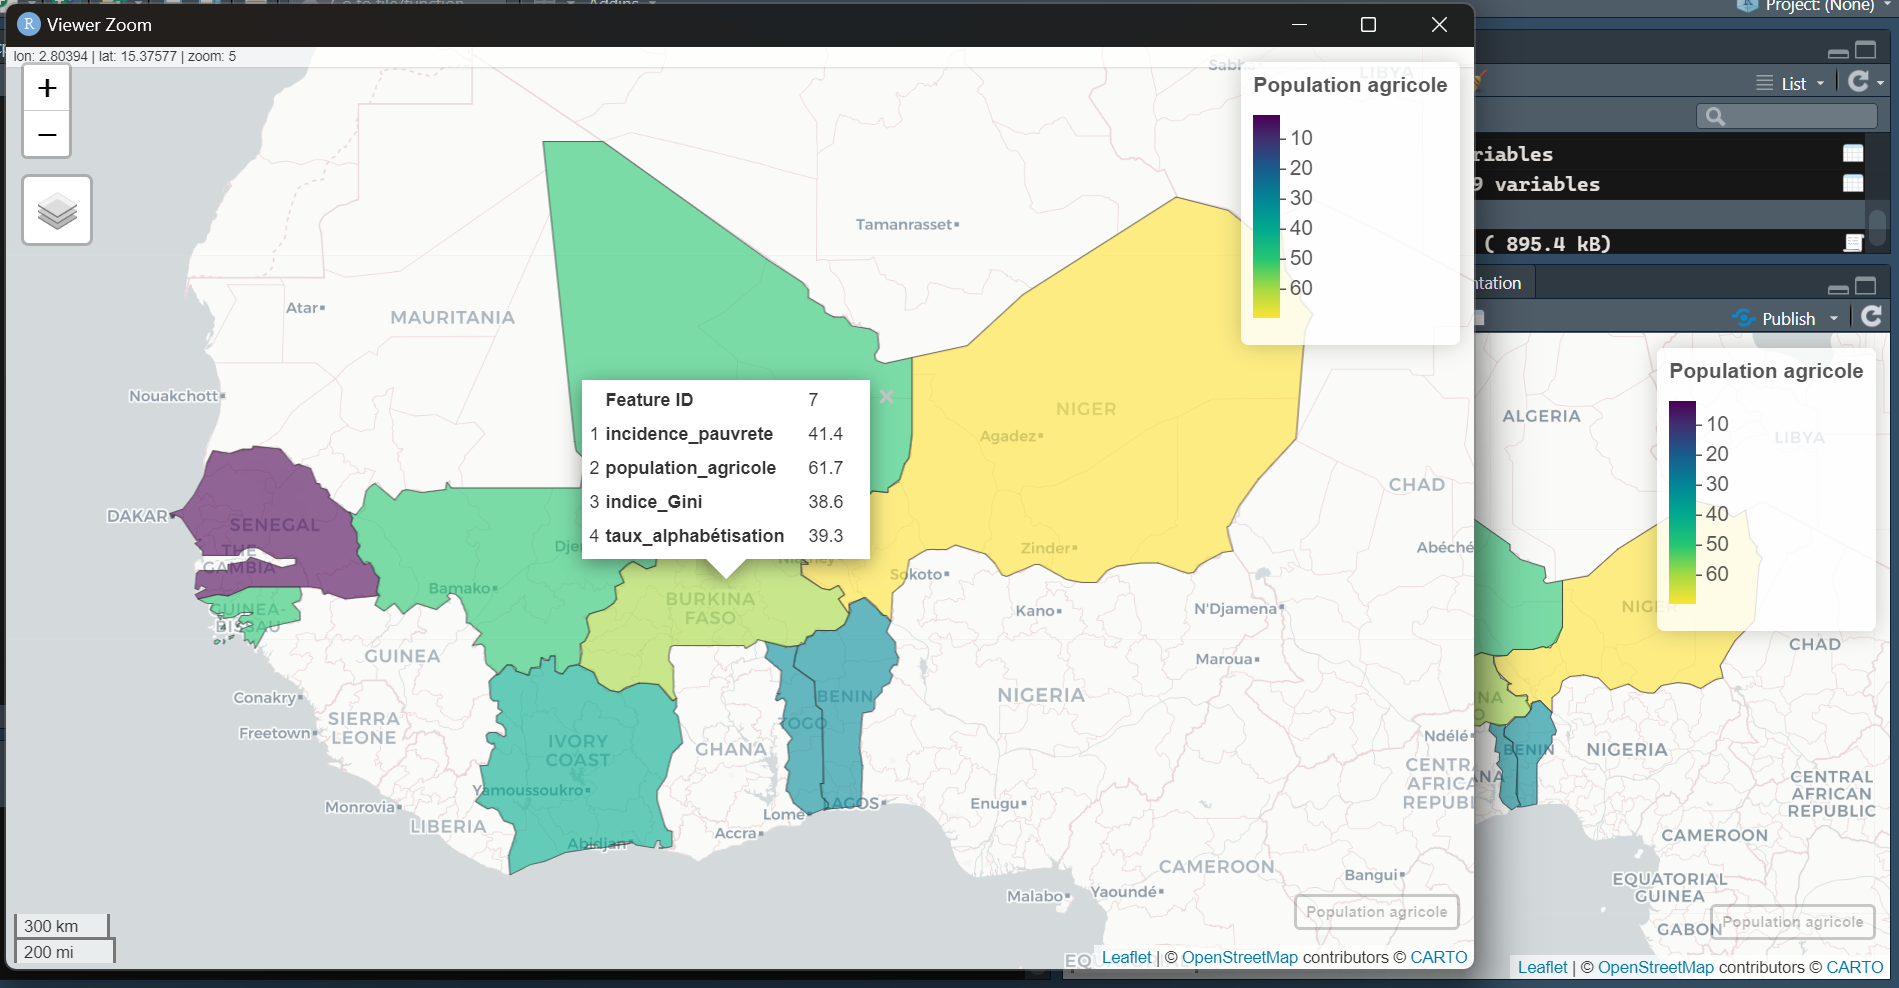
💻 This project gives a descriptive overview of mapping with R and highlights its power in geospatial data analysis. Like Python, R offers a number of libraries for spatial data analysis. In this project I present five very useful libraries for mapping indicators: sf, cartography, tmap, leaflet, mapview. 🗺️💡
💻Geospatial analysis can be used for descriptive studies on a wide range of subjects such as climate change, COVID-19, unemployment and inflation 📈. It is also useful for spatial regressions, impact assessments and even machine learning! 🎯 For example, you can view house prices in several locations and compare them with the prices predicted by a regression model (on two maps); you can examine the correlation between indicators on a map, and so on. 🎯
📌 In short, this approach is useful in a multitude of situations, such as monitoring sales in different regions, monitoring evaluation at departmental or local level, evaluating impact in time and space, tracking a company's turnover by town or region, etc.
Liens :