Overview
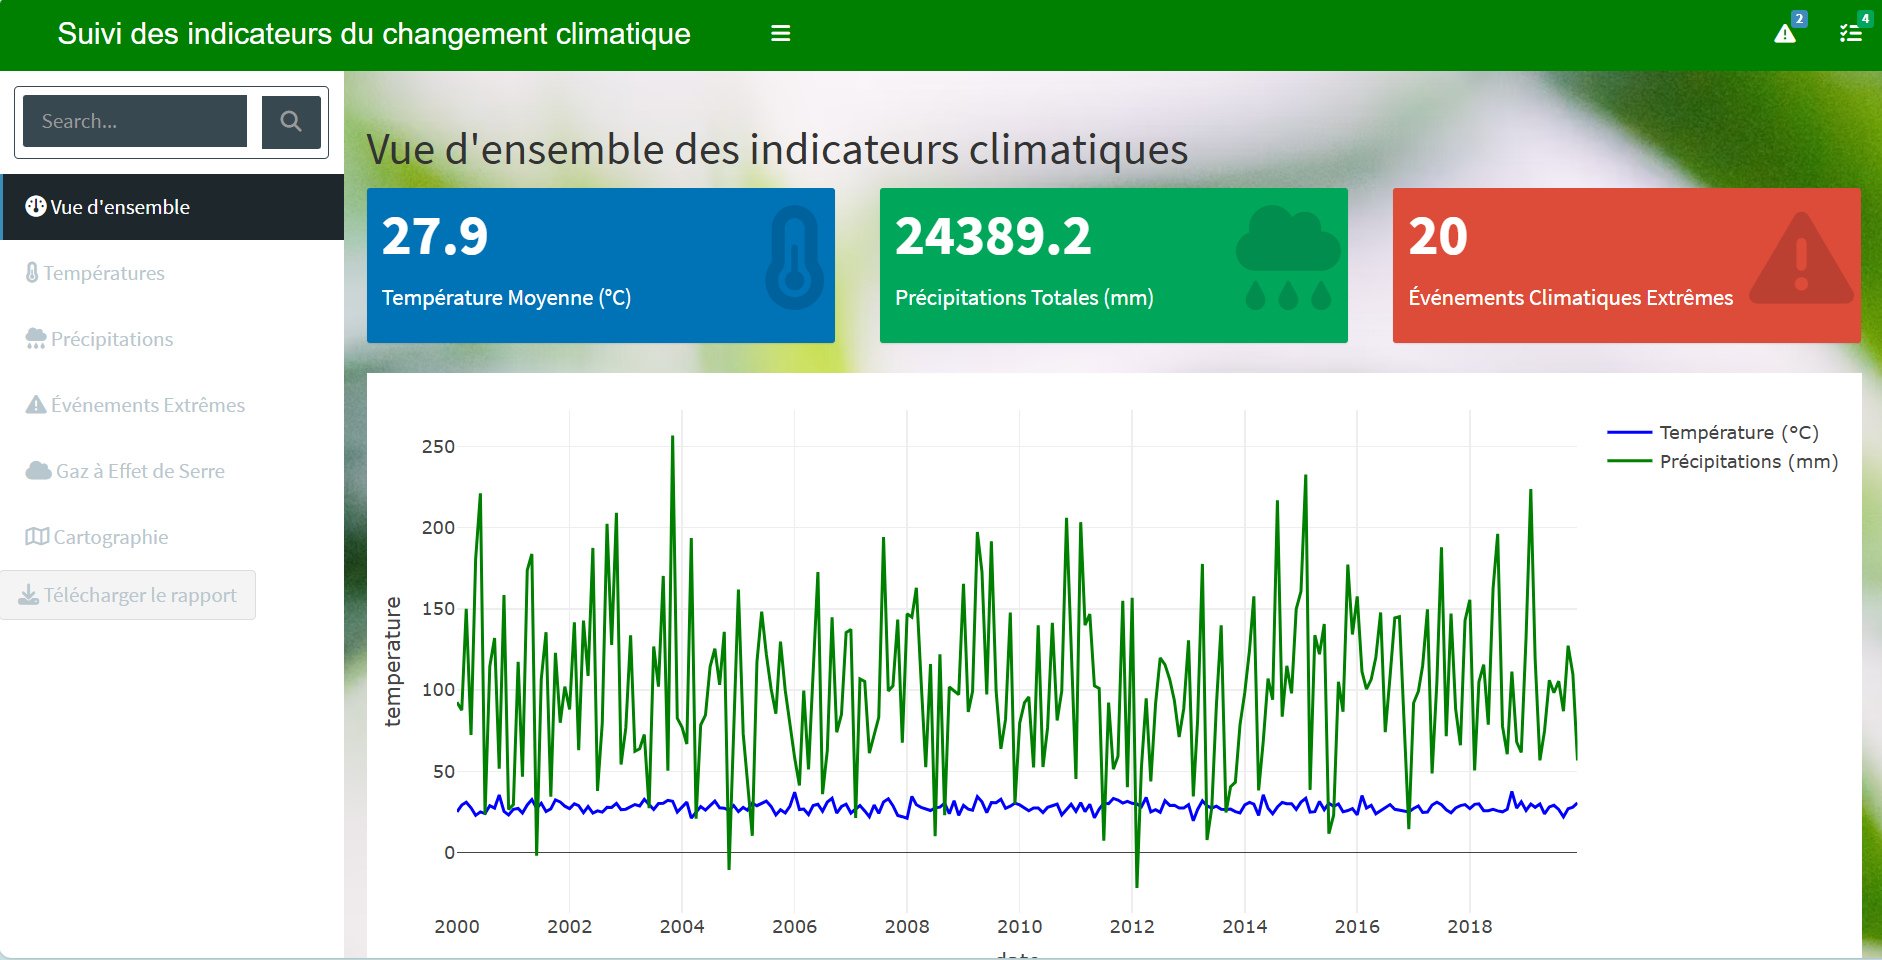
This climate change monitoring dashboard project, developed with R Shiny, offers a dynamic and interactive view of trends in the main climate indicators. The dashboard is designed to enable users to visualise climate trends by region, country or on a global scale. By gathering data on variables such as greenhouse gas emissions, average temperatures, precipitation levels and extreme weather events, this application provides an in-depth, real-time analysis of the impacts of climate change.
Privacy Github : Climate Change.