Overview
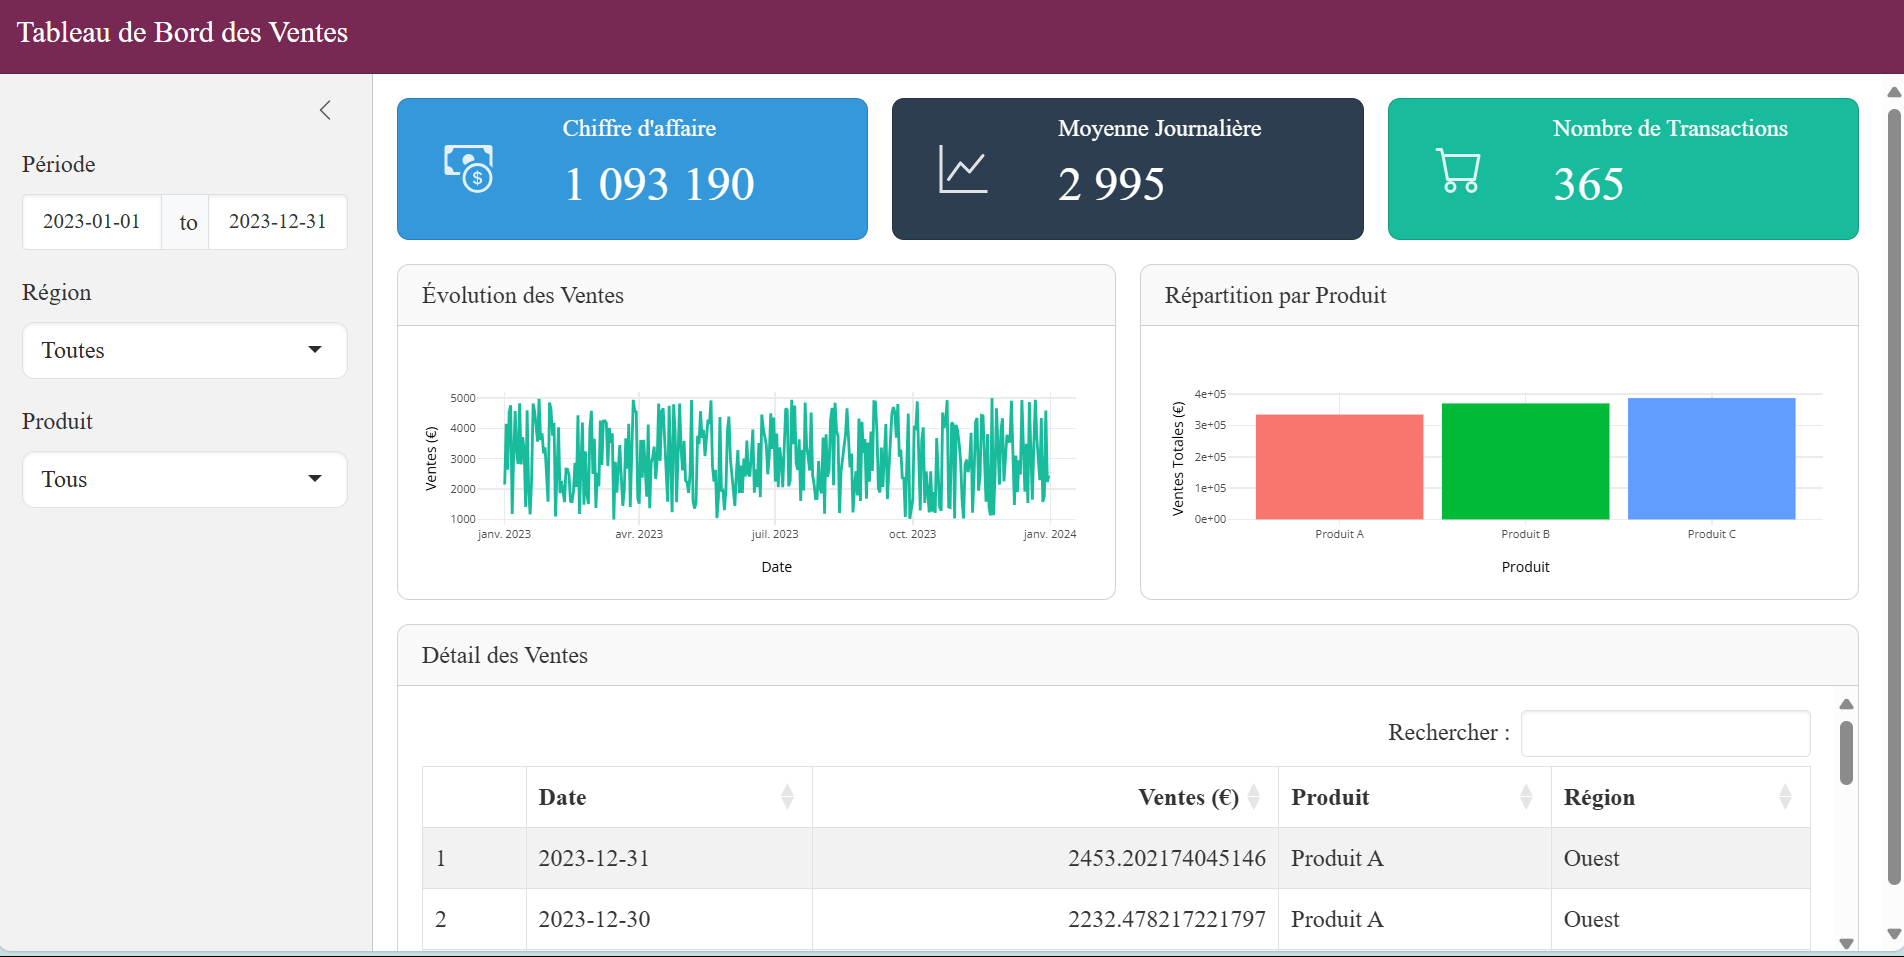
Interactive dashboard designed to provide a complete sales analysis. This application is useful for visualising and monitoring sales performance, and allows data to be filtered by region, period and product type. It provides instant access to key performance indicators such as total sales, daily average and number of transactions, thanks to dynamic widgets that display these metrics in real time. lol
The dashboard also incorporates interactive graphs for optimal data visualisation, tracking sales over time or exploring the breakdown by product to identify trends. Finally, a detailed table completes the application, offering in-depth access to data for detailed analysis and sound decision-making.
Technologies
- R shiny
- HTML
- CSS