Overview
This interactive application presents socio-demographic analyses of survey data, as well as monitoring and evaluation indicators and economic aggregates.
It proposes:
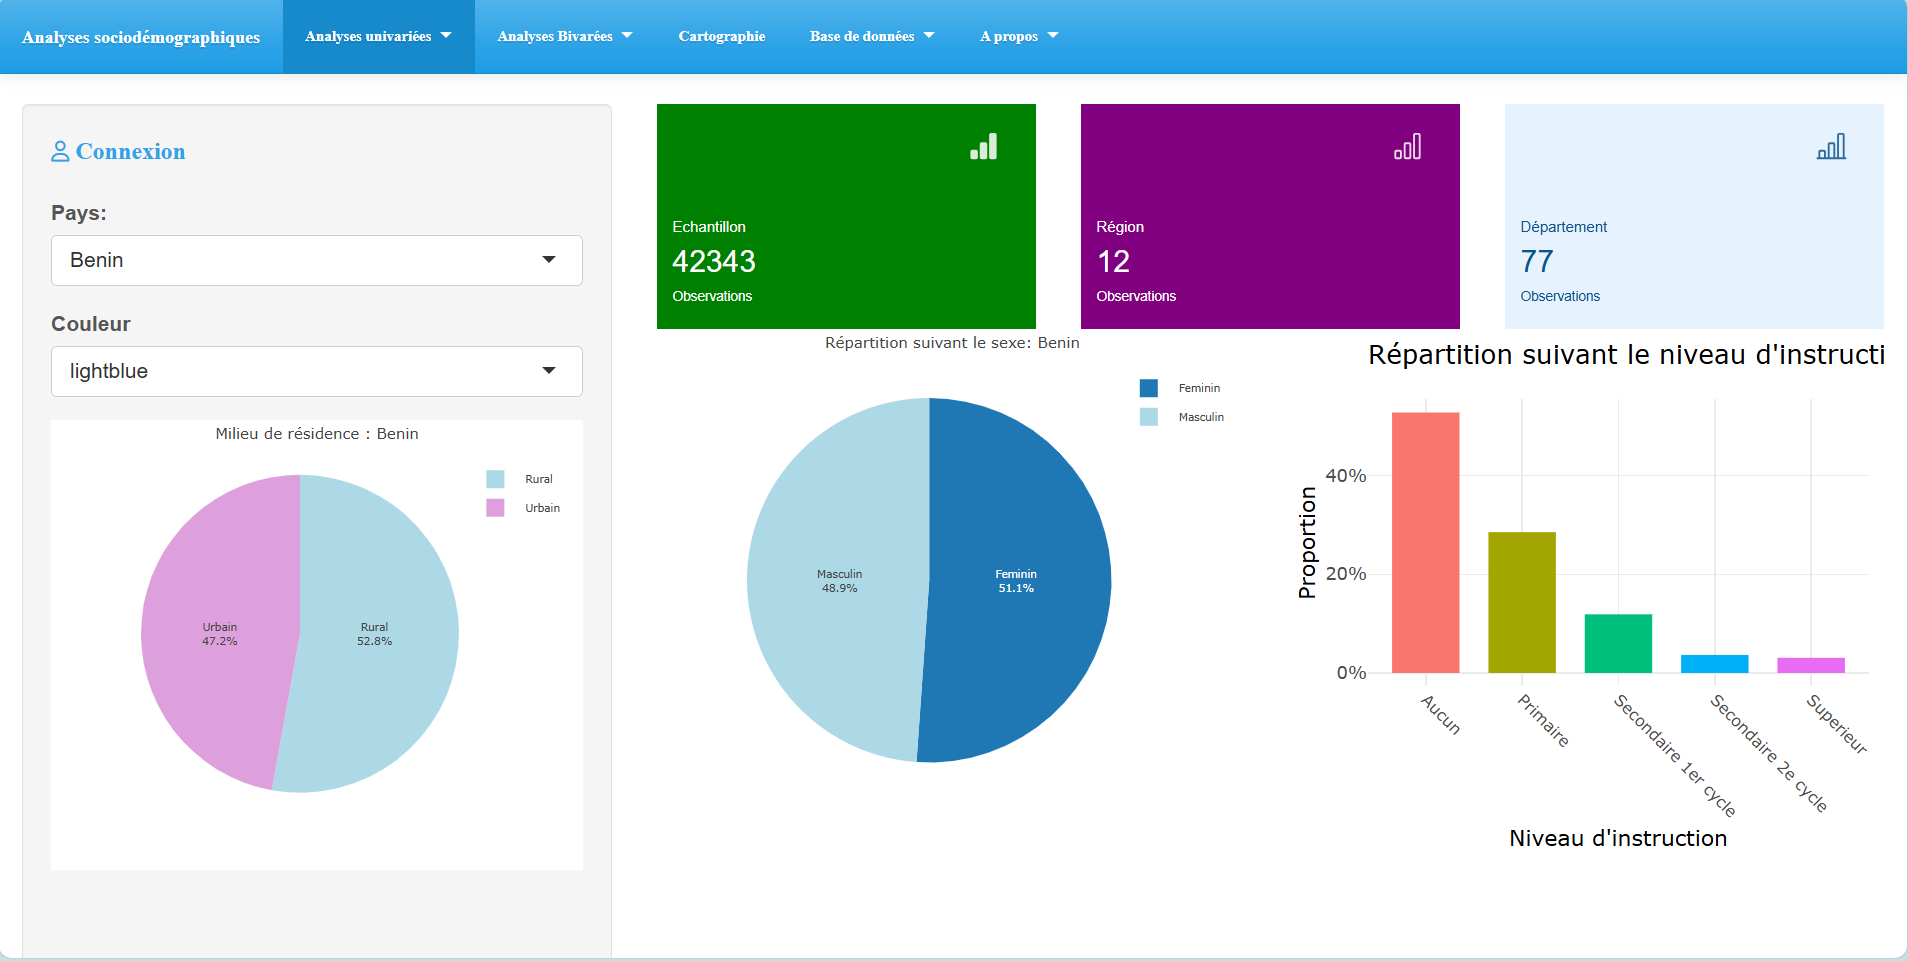
- 📊 Univariate analyses: for example, the breakdown of the sample by geographical area, gender, level of education, and much more.
- 🔍 Cross-tabulated statistics: analysis of socio-professional categories by place of residence or level of education, and breakdown of the working population by gender.
- 🗺️ Interactive mapping: display of all indicators at sub-regional level, with the option of carrying out analyses by region or department.
Ideal for presenting non-technical results and the main trends of a study to a wide audience. 🌍 Finally, it is possible to download the dataset as required (according to the number of rows, the number of columns or through filters).
Click on the link below. Once the link is open, fill in the following information by clicking on the Connexion button in the top left-hand corner of the left-hand side panel:
User’s name : julien
Passeword : 0000
Link : Monitoring and evaluation.